
An alleged ‘research paper’ shared by an Ashoka University professor, Sabyasachi Das has been making the rounds in social media. The paper has allegedly not yet completed the critical review process and has not been published in any academic journal, the univ said.
The paper is allegedly about how the Bharatiya Janata Party (BJP) has been manipulating elections in India. A Twitter user M R Sharan shared an extensive thread on this “research”.
Ashoka University, however, clarified its stance, emphasising that while they promote research endeavours, they do not dictate the selection of individual research projects conducted by their faculty members. The university underscored that their emphasis lies on research papers that have undergone rigorous peer review and are subsequently published in esteemed journals.
Ashoka University is dismayed by the speculation and debate around a recent paper by one of its faculty members (Sabyasachi Das, Assistant Professor of Economics) and the university's position on its contents.
As a matter of record, Ashoka University is focused on excellence in…
— Ashoka University (@AshokaUniv) August 1, 2023
A Twitter user who goes by the handle @saiarav neatly diced the paper and presented facts in Twitter threads debunking the entire paper and the threads have been reproduced here with permission:
Summarising the claims of the paper:
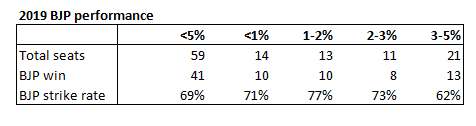
A) BJP won 41/58 LS seats in 2019 where the margin of victory was <5%. The normal expectation would be that it would win 50% or 29 seats, so BJP’s strike rate is a 12-seat outperformance.
The BJP won the 2019 parliamentary elections in India: but was it ALL fair and square?
This astonishing new working paper by @sabya_economist provides scientific evidence that suggests vote(r) manipulation by BJP.
And no, this is NOT about EVMs.https://t.co/H99CGJPhTV
Thread🧵 pic.twitter.com/YU1idLcqXw— M.R. Sharan (@sharanidli) July 31, 2023
B) The o/p can be attributed to either better electoral management or electoral manipulation. The paper seeks to prove it is due to manipulation.
C) There are two types of possible manipulation – deletion of minority voters from electoral rolls (registration manipulation) and manipulation at the time of voting (ballot stuffing for example) and while counting votes (both together called turnout manipulation).
As would be evident, for both registration manipulation and turnout manipulation, BJP will be in a position to do it only in states where they are part of the ruling alliance. So if indeed the victories were due to manipulation, one would see the higher strike rate being restricted to the NDA-ruled states. the author, in fact, even makes that claim.
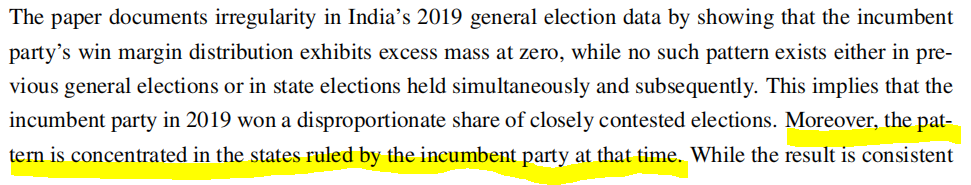
However, for the complicated statistical jugglery exhibited throughout the paper, it gets this basic fact wrong. This pattern of outperformance is not limited to NDA-ruled states. Out of the 41 seats it won, nearly half are from non-NDA states.
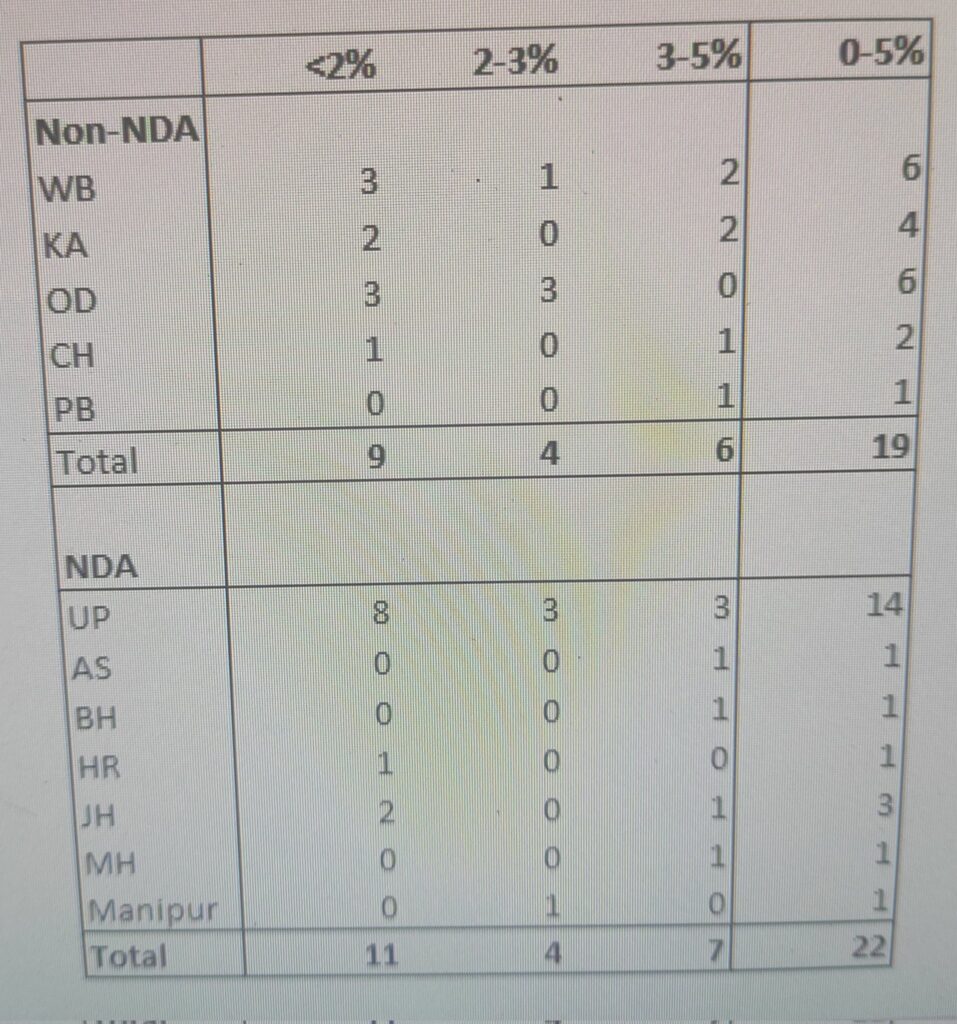
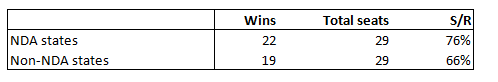
Not just that, it has a S/R of 66% wins in non-NDA states which clearly points to a superior electoral machinery.
Sure, its S/R is even better at 76% in NDA-ruled states. But this can very easily be explained by the fact that these are in states where BJP’s traditional strongholds and therefore BJP is more efficient in election management.
**Note – 63% strike rate for non-BJP states in Nabrangpur (Odisha) is included which was a 3-cornered contest where BJP came third but margin versus was winner was <5%
As an aside, BJP’s lowest S/R is Bengal where it lost 4/10 closely contested seats – and we can be pretty sure that was not because of electoral manipulation by Mamta, right?
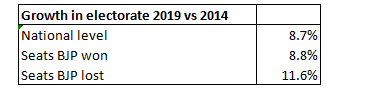
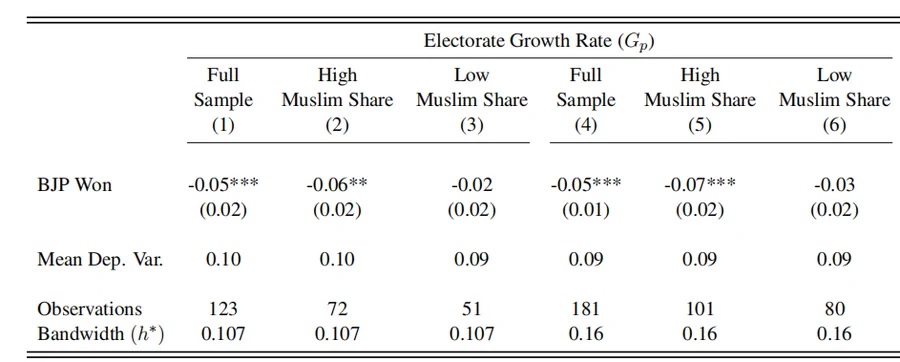
The evidence offered by the author for registration manipulation is that the growth rate in the electorate (vs 2014) in seats BJP won narrowly is 5% lower than the growth rate in ones it narrowly lost. Sounds compelling at first glance but turns out there is nothing at all abnormal with the growth rate of the electorate in BJP-win seats – the electorate grew by an average of 8.8%, right in line with the national electorate (8.7%)! It is those 17 seats that BJP lost narrowly which has an anomalous growth rate averaging 11.6%.
Evidence#3: Voter rolls are manipulated
Das shows that the growth rate in voters between 2014-19 is smaller in constituencies where BJP narrowly wins.
So – names are being deleted.
Q: Whose?
Analysis of names of voters in the voter rolls suggests that these are Muslim names pic.twitter.com/WKrobkxqlD
— M.R. Sharan (@sharanidli) July 31, 2023
All 4 seats BJP lost in WB had electorate growing higher than the national average – of course, that can’t be due to TMC indulging in electoral manipulation, can it? Anyway, the point is the author is indulging in outright statistical fraud when he claims BJP was deleting Muslim voters in these seats.
It turns out Sabyasachi Das has erred in assuming the two centrally administered territories – Andaman & Nicobar and Dadra & Nagar Haveli – as non-BJP ruled. This leads to erroneous S/R for BJP vs non-BJP states. He will also have to rework all his charts and data to correct for the above.
Sabyasachi Das also has included Nabarangpur (Odisha) in the list of narrowly lost seats by BJP but the party was a distant third in that seat. Indian National Congress came second there. It turns out Sabyasachi Das has erred in assuming the two centrally administered territories – Andaman & Nicobar and Dadra & Nagar Haveli – as non-BJP ruled.
Given the overall small size, I bet it makes a meaningful difference to the results. For starters, the McCrary test, which forms the basis of the paper, will look very different, severely undercutting the thesis.
A Closer Look At The Issue Of Lower Electoral Growth Rate
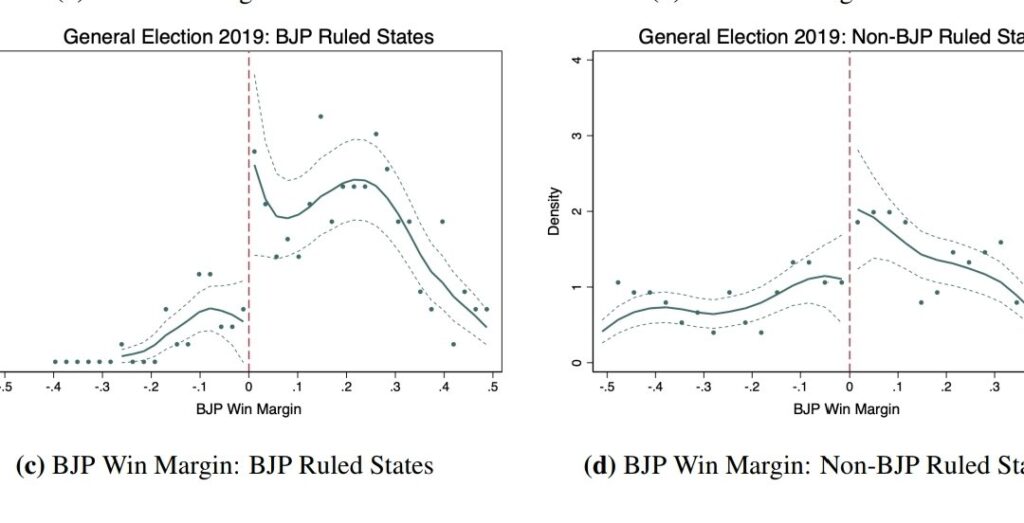
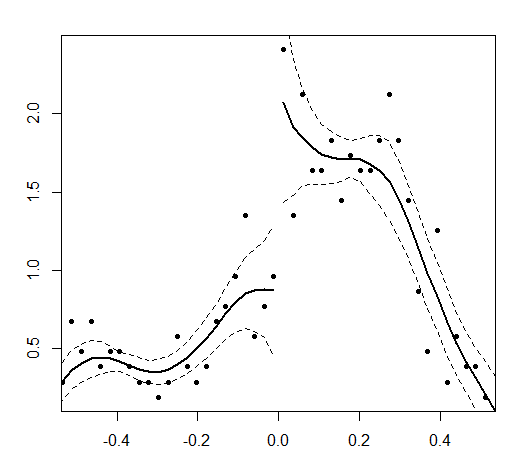
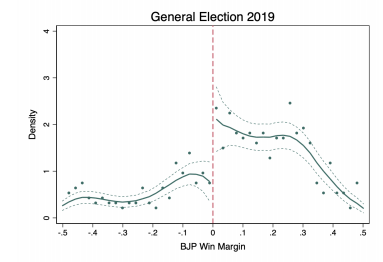
Recreating the RDD chart validates the point that it is the narrowly-lost seats that show an abnormally high growth rate. Now we come to the most damning part of Sabyasachi Das’s paper. His claim that, in very narrow victory margins, the 2019 electorate growth rate of BJP-win seats was 5% lower than BJP-loss seats.
The implication is clear – BJP might be deleting names of Muslim voters in seats with close contests (and hence the outperformance, failure of the McCrary test).
Someone pointed out to me that, for this analysis, no chart was provided. Well, turns out it was for a good reason. Because when plots the chart, turns the boot is on the other foot! Take a look at the chart (the horizontal line is the average growth in the electorate -~9%). What does it show?
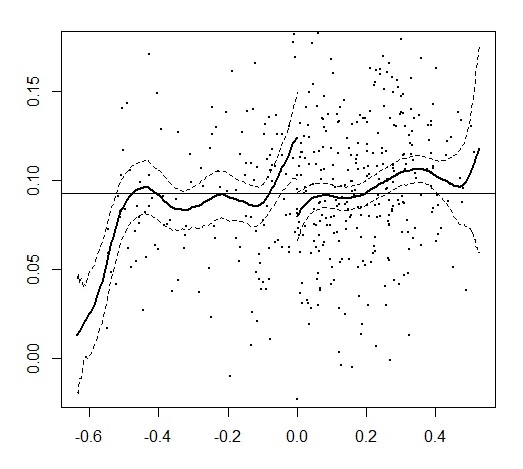
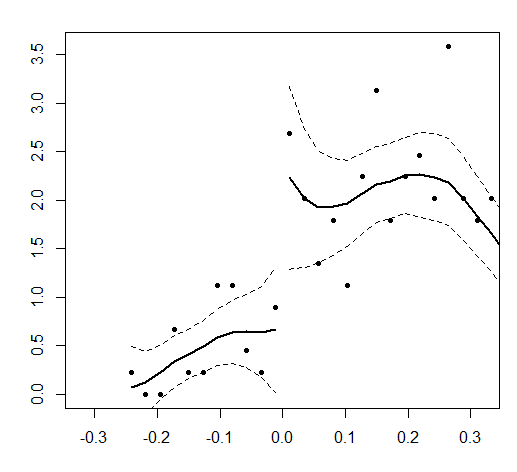
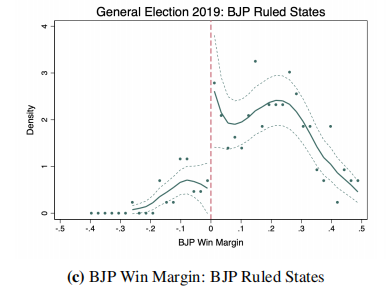
The electorate growth in narrow BJP wins is right in line with the national average. On the other hand, on the narrow-loss side, there are many seats with electorate growth way above average! And, that dear friends, is what is driving the -5% discontinuity jump.
Some of the narrow loss seats are in Bengal where the electorate growth is as high as 17% – almost double the national average. Knowing how the state is run, one can legitimately speculate about manipulation except that it will not be from the BJP, but from the TMC, in adding fake names to the rolls (but that is the subject of another paper).
Some other narrow-loss seats are just genuine outliers. For example, Andaman & Nicobar, which BJP lost by 0.7% showed an 18% growth. Dadra & NH, which again BJP lost by 4.5% saw a growth of 27%.
So what happens if we remove the outliers in electorate growth – say, all seats with growth of >15% and victory margin of <5%? The discontinuity shrinks to 1.2% from the 5% claimed in the paper.
Examining The Assumption Of Alleged Manipulation By The BJP
I believe there is a fundamental error in Sabyasachi Das’s paper which makes most of the analysis redundant – The paper says the McCrary test does not fail in non-BJP states despite discontinuous jump because the p-value is >0.05. But corrected for input errors, I find that p-value <0.05.
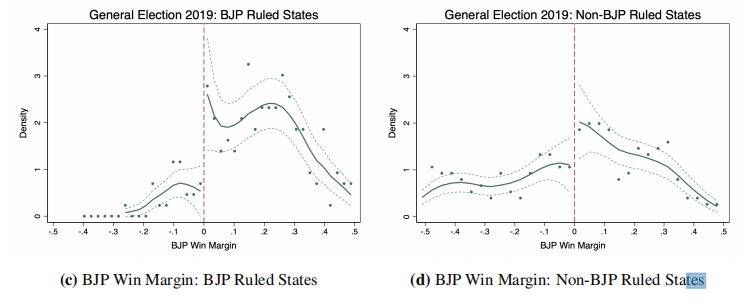
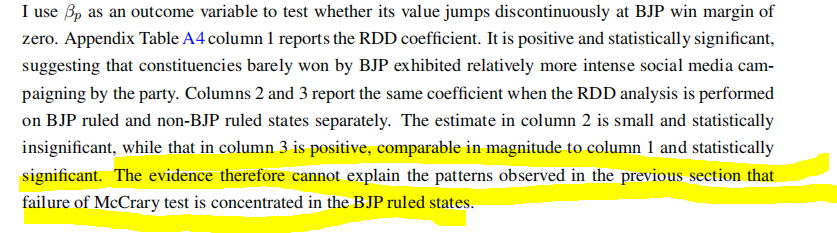
Why is this important? Because if the McCrary test fails in BJP-ruled states and doesn’t in non-BJP states, it implies that the outperformance in the former is possibly due to electoral manipulation using the state machinery, a point that is repeated throughout the paper.
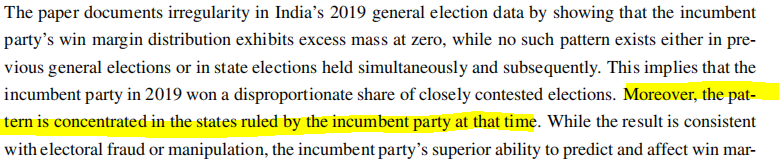
On the other hand, if the McCrary test fails even in non-BJP states, then the hypothesis of precise control (i.e., superior electoral management becomes the dominant hypothesis). Das’ perfunctory rejection of the precise control hypothesis based on two questions from CSDS becomes untenable, especially because on the question of social media being a differentiating factor, the paper itself finds that in non-BJP states, BJP’s outreach was superior.
Of course, the casual rejection of the precise control hypothesis is untenable anyways considering that there are a dozen other ways of superior electoral management apart from worker visits to voters’ homes and social media outreach (perhaps, these aren’t even the two most important ones).
Ok, now let me get to the part about what Das got wrong. He classified the two centrally administered UTs (both seats that BJP lost) as non-BJP. Considering that the centre has administrative control over these seats, it stands to reason that they can indulge in the exact same manipulation (voter deletion, counting fraud, etc) as is being alleged for BJP-ruled states. Once we move the two seats to BJP-ruled states, the p-value of non-BJP states moves to <0.05.
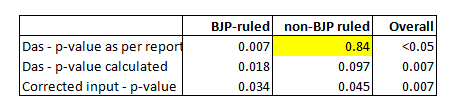
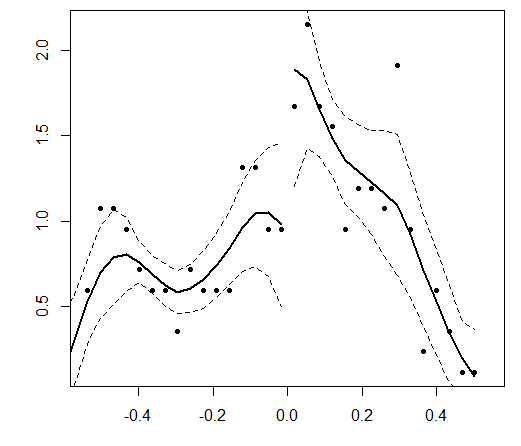
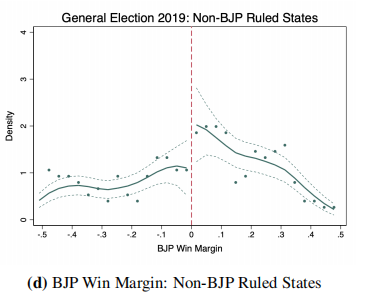
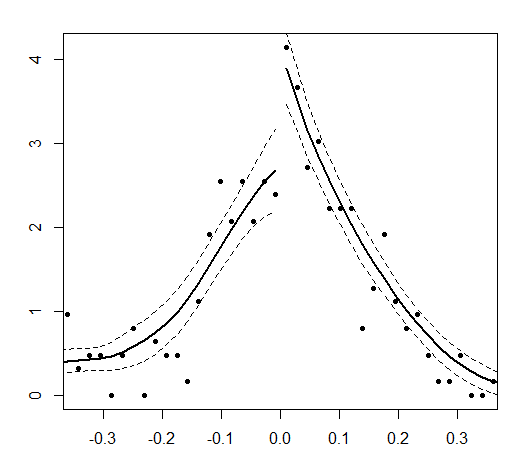
Voila! The outperformance of BJP in non-BJP now becomes statistically significant. So below is the p-value for each of the McCrary tests. Note that I am getting higher p-values than Das (probably due to him having a different bin width) and that’s even better because despite my p-values estimates being higher, I am getting p-value <0.05 for non-BJP ruled states. So under Das’ assumption, it should be even lower. I have replicated the McCrary charts (with those two erroneous data inputs) and my charts are fairly close to Das’s.
BJP Overall:
BJP states:
Non-BJP states:
Assessing Claims Of Unprecedented 2019 Outperformance
Another claim of Sabyasachi Das is that the McCrary test hasn’t failed in the past. Well, in both 2004/1999, there is a discontinuity for BJP – rejected only because of P>0.05. But when I use a bandwidth of 0.16, for 1999, I get a p-value of 0.037 which implies that the test fails!
This is a great example of what Professor Shamika Ravi says – A difference between ‘significant’/’not significant’ itself is statistically insignificant! Minor changes in assumptions can change p making a result significant or insignificant depending on what u want.
Shamika Ravi says the following after reading the working paper on Democratic Backsliding.
I finally read the working paper on Democratic Backsliding. The basic premise rests on close elections in 2019 being different from past close elections. When one looks at the data provided in the appendix, you don’t find any statistical difference b/w 2019 Vs 2004! #DeskReject pic.twitter.com/gxaYJ5MwDV
— Prof. Shamika Ravi (@ShamikaRavi) August 5, 2023
“The basic premise rests on close elections in 2019 being different from past close elections. When one looks at the data provided in the appendix, you don’t find any statistical difference b/w 2019 Vs 2004! #DeskReject. One must learn to separate political ideology from statistics. Pls read Gelman and Stern article (published) for better understanding and to avoid “misinterpretation & misrepresentation of statistical outcomes.””
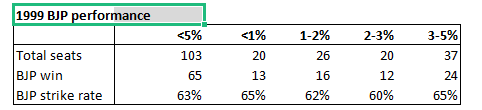
For the record, BJP won 65/103 seats in 1999. Here is the comparison between 1999 and 2019 for closely contested seats broken down in more detail.
Ashoka University is dismayed by the speculation and debate around a recent paper by one of its faculty members (Sabyasachi Das, Assistant Professor of Economics) and the university's position on its contents.
As a matter of record, Ashoka University is focused on excellence in…
— Ashoka University (@AshokaUniv) August 1, 2023
(Data published from Sai Arav’s Twitter)
(Yajnavalkya is an avid watcher of the Indian political economy)
Click here to subscribe to The Commune on Telegram and get the best stories of the day delivered to you personally.


